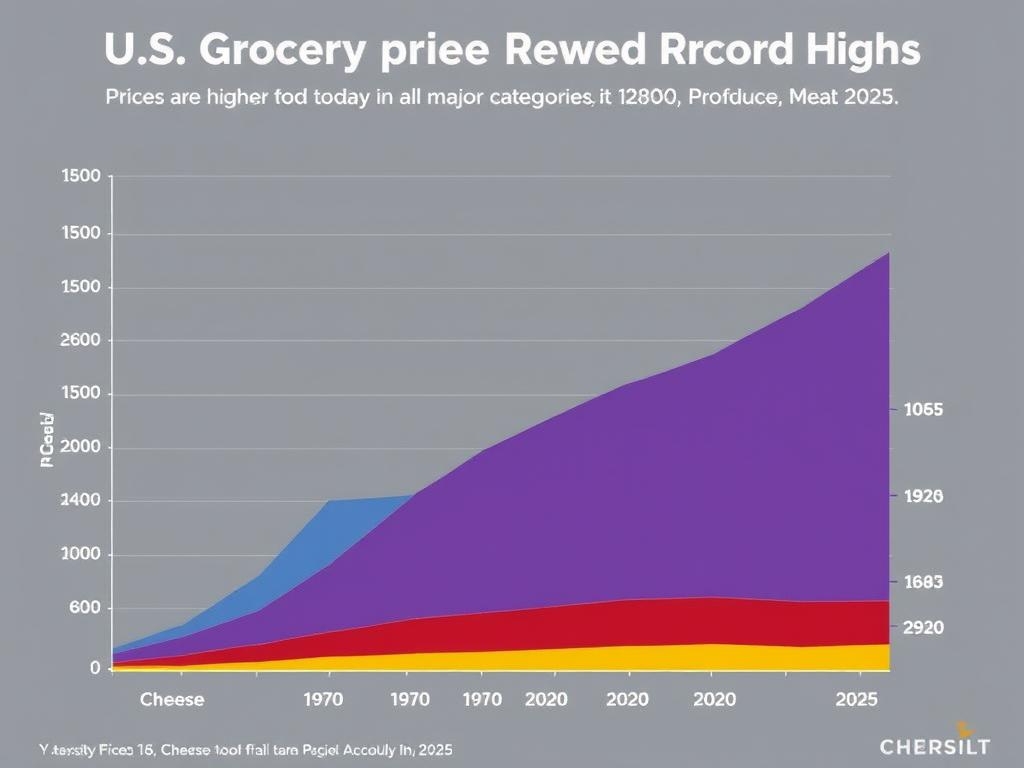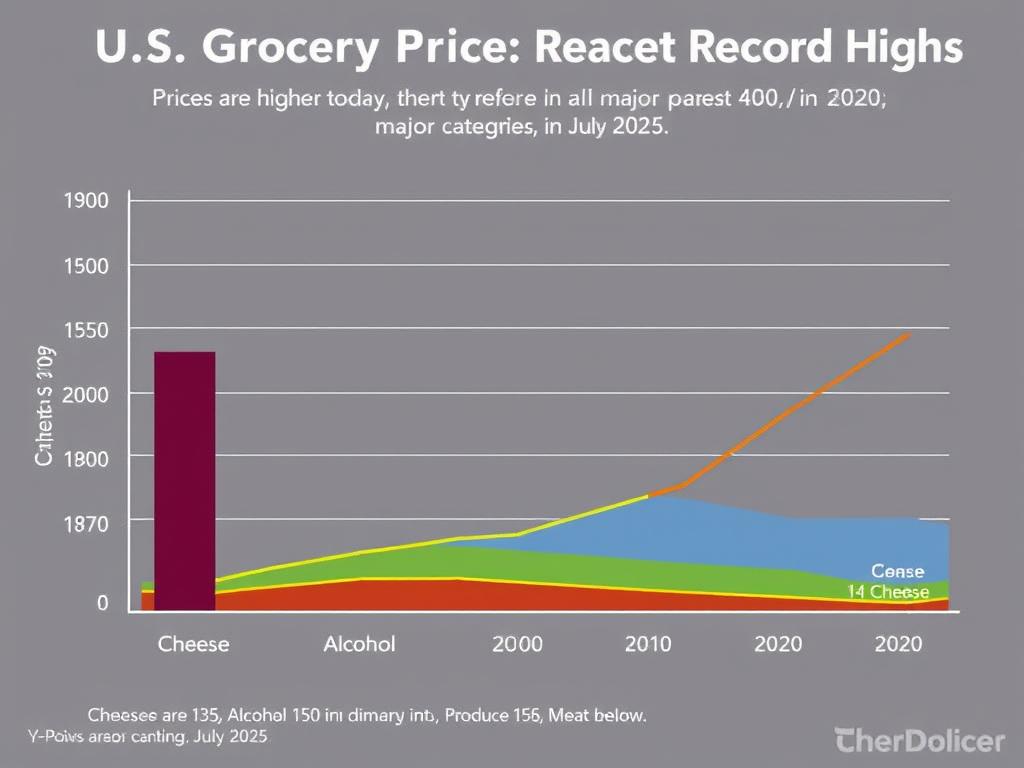
Chart DescriptionTitle US Grocery Prices Reached Record Highs In 2025 Subtitle Prices Are Higher
Chart Description:Title: U.S. Grocery Prices Reached Record Highs in 2025 Subtitle: Prices are higher today than they were in 1980 in all major categories listed below: Y-Axis: Index Value (ranging from 100 in 1980 to approximately 400 in July 2025) X-Axis: Years (1980, 1990, 2000, 2010, 2020, 2025) Colors and Categories:Cheese: Maroon Alcohol: Green Grocery: Blue Dairy: Purple Produce: Red Meat: Yellow Data Points:1980: Cheese 100, Alcohol 100, Grocery 100, Dairy 100, Produce 100, Meat 100 1990: Cheese 135, Alcohol 125, Grocery 130, Dairy 128, Produce 132, Meat 140 2000: Cheese 170, Alcohol 150, Grocery 160, Dairy 158, Produce 165, Meat 180 2010: Cheese 210, Alcohol 185, Grocery 200, Dairy 195, Produce 205, Meat 225 2020: Cheese 275, Alcohol 240, Grocery 260, Dairy 255, Produce 265, Meat 290 2025 (July): Cheese 360, Alcohol 310, Grocery 340, Dairy 330, Produce 345, Meat 380 Visual Notes:The lines start at 100 in 1980 and rise steadily, with Meat (yellow) showing the steepest increase, followed by Cheese (maroon). Alcohol (green) has the slowest growth. The chart resembles the original with multiple colored lines diverging over time, peaking highest in 2025. The background is white, with a black title and subtitle, and the y-axis is scaled to accommodate the growth (e.g., 100 to 400). You can copy this data into a graphing tool to visualize it with the same styling. Let me know if you need help with that!
30.07.2025 04:28