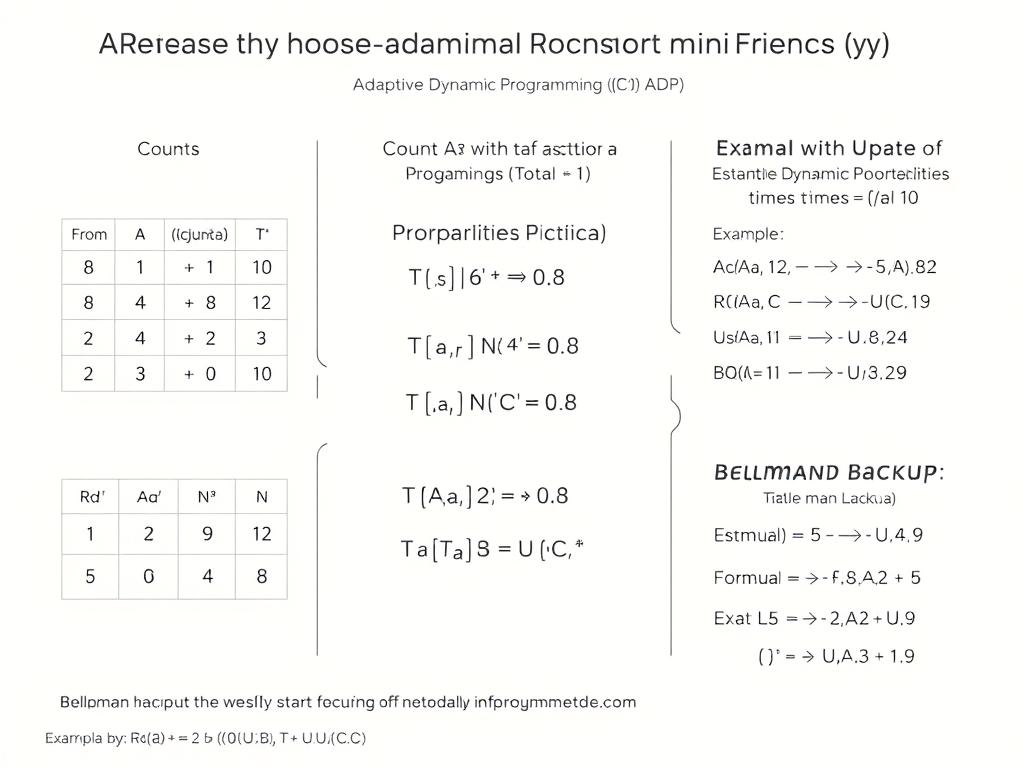
*Create A Clear Educational Diagram That Shows A Numeric Example Of Adaptive Dynamic Programming (ADP)
*"Create a clear educational diagram that shows a numeric example of Adaptive Dynamic Programming (ADP) in Reinforcement Learning. Use a minimal flat infographic style with soft academic colors. Layout: Left side: Counts Table (observations) Title: “Counts” Example: From A with action a → B = 8 times, → C = 2 times (Total = 10) Middle: Probabilities (T) Title: “Estimated Transition Probabilities” Show formula: T(s,a,s′) = N(s,a,s′)/N(s,a) Example: T(A,a,B) = 0.8 T(A,a,C) = 0.2 Right side: Bellman Backup Title: “Bellman Update for U(A)” Formula: U(A) = R(A) + γ [0.8U(B) + 0.2U(C)] Example with numbers: R(A) = 2, γ = 0.9, U(B)=5, U(C)=1 Calculation: U(A) = 2 + 0.9*(0.85 + 0.21) = 5.78 Style: clean infographic, arrows pointing from Counts → Probabilities → Bellman Equation → Final Utility. Include simple icons (table 📊, probability pie chart, formula symbol 📐). Use blue, green, and orange for clarity."*
02.09.2025 16:14
Related Images