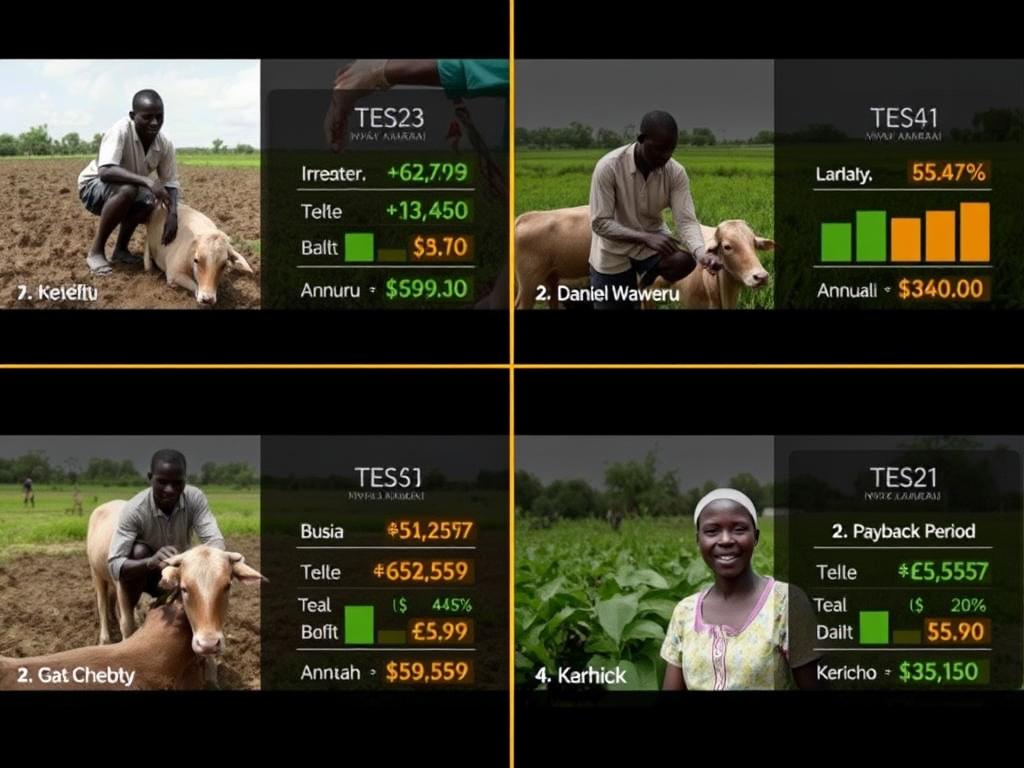
Create A Four-quadrant Split-screen Video Showing Synchronized Economic Metrics For James Kimutai –
Create a four-quadrant split-screen video showing synchronized economic metrics for: James Kimutai – Nyandarua (Dairy Integration) Daniel Waweru – Nakuru (Rotational Grazing) Peter Omondi – Busia (Terrace-Fodder Integration) Grace Chebet – Kericho (Tea-Dairy Integration) Each quadrant shows the farmer working on their farm (authentic footage) beside animated infographics of: Investment cost, annual benefits, ROI %, payback period Kenyan Shilling symbols (KES), numeric clarity, consistent color scheme (green = profit, amber = cost). Visual design: Matte black background grid with gold divider lines. Each quadrant labeled by name and county. Currency data animates with count-up effect. Lighting: Clean daylight from each real farm region. Mood: Analytical clarity meets optimism — transformation made visible.
03.11.2025 10:08
Related Images