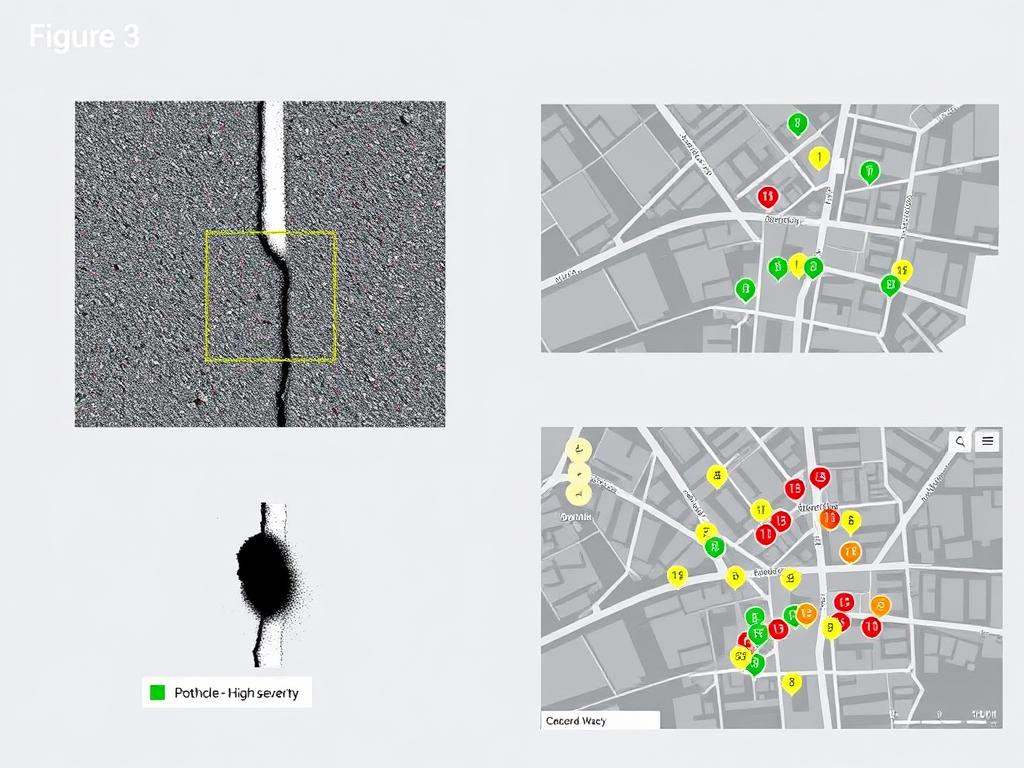
Figure 3 – UAV Damage Detection Example UAV Image Of Road Bounding Box Around Crack/pothole (YOLO
Description
Figure 3 – UAV Damage Detection Example UAV image of road Bounding box around crack/pothole (YOLO output) Label showing “Pothole – High Severity” (This proves the AI detection output.) Figure 4 – GIS Dashboard Mockup Map of city roads with colored markers (Green = low severity, Yellow = medium, Red = urgent). Each marker linked to UAV image & severity report.
Created On
27.08.2025 18:12
Related Images

side angle photo, in dance studio, very skinny but large-ch

painting: in the steampunk decor shop window, a mannequin we
A black and white image of a person in pensive focus, his ba

green planet Earth from orbit, seeing from top-front vector

Erzeuge ein Bild einer hübschen, jungen Frau mit langen, bl

in the painting, the showcase of a dressmaker with steam-pow

sweet Korea girl wearing light pink Tight shiny nylon boy sh

Cute plush Whale dressed up as vanilla cake with whipped cre

"Intricate pen and ink drawing A dark, mythical Western

kids roaming around in an indian village during diwali night

Picture for a Cd-cover with Kenworth Truck and text "Ol

A stunningly beautiful, athletic, petite blonde woman resemb

Temporary employment agency employees of different complexio

ANIMATION REALISTIC: Man wearing suit & tie DEMONSTRATIN